 Startup Delayer
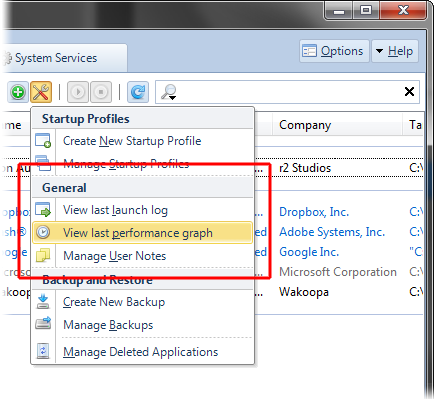
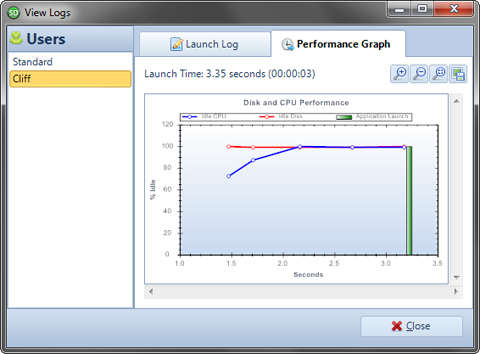
The Performance Graph window displays a graph of the most recent Startup launch. The Performance Graph window can be accessed from the Logs menu item.
The Performance Graph displays statistics about your Startup Process by representing the Idle monitors as a percentage of Idle. The Green bars represent when an Application was launched during the Startup Process and allow you to see how busy your Computer was during the Startup and when Startup Delayer was able to launch your applications.
ativan australia
clonazepam australia
stilnox australia
xanax australia
zopiclone australia